


TL;DR:
- Calculating ROI in user research means tying user experience improvements to business outcomes. Teams need to translate insights into metrics stakeholders care about: revenue, retention, time and cost savings.
- Focus on connecting UX metrics to business impact, like showing how improved task success and drop-off rates can lead to increased revenue and fewer support tickets.
- Reframe research as a driver of outcomes, not a phase of the process. Align it with your UX research plan, speak in business metrics, and bring stakeholders in early.
Stakeholders aren’t asking whether user research is useful—they’re asking if it’s worth the investment.
This means UX researchers, product managers, and designers need to switch from being technical executors to research advocates. You need to translate user insights into business outcomes—like higher conversion rates, lower churn, faster launches, and increased revenue. In other words, return-on-investment (ROI).
The numbers speaks for themselves—companies that embed user research into business strategy see:
- 3.6x more active users
- 2.8x increased revenue
- 5x improved brand perception
- 3.2x stronger product–market fit
Despite this, teams still struggle to quantify user research ROI in terms that resonate with leadership. To give you a headstart, we’ve put together a foolproof strategy for measuring and communicating the ROI of user research (even to the trickiest of stakeholders).
Step-by-step: How to calculate user research ROI
We spoke with Geoffrey Crofte, Senior UX Lead at Foyer Group, for an honest look at how UX professionals approach proving user research ROI. Here’s his tried-and-tested tips to communicate the value of UX research initiatives, connect research to business value, build stakeholder trust, and secure long-term buy-in.
1. Consider return-on-experience over return-on-investment
The main challenge in proving research's value is that the ROI of user research is often indirect.
Geoffrey Crofte
UX Author and Senior UX Lead at Foyer Group
Share
One of the biggest hurdles to overcome when making a business case for research is connecting your work to business outcomes. When it comes to user research, these journeys are often more…roundabout.
Research doesn’t always produce linear, dollar-in-dollar-out metrics—rather, it reduces risk, prevents costly rework, and enables faster, more confident decision-making.
To demonstrate this Geoffrey suggests thinking about ROI of user research as ROE (return-on-experience), which later turns into ROI:
“ROE measures the value generated by improving users’ experiences. It considers qualitative and quantitative outcomes, like increased user satisfaction, reduced friction, and improved task completion rates.”
2. Identify relevant UX metrics and establish benchmarks
The first practical step in calculating ROI is to define what you’re measuring. That starts with selecting user experience KPIs and metrics that reflect key outcomes your research is designed to influence—ideally, UX metrics that can later be tied to business performance.
According to our 2024 Future of User Research Report, the most commonly-tracked UX metrics include:
- Time on task
- Task success rate
- Drop-off points in flows
- Error rate and misclicks
- User satisfaction scores (e.g., NPS, SUS)
- Each of these captures a different facet of user experience. For example:
If you're testing a redesigned onboarding flow, tracking task success rate and time on task can reveal how efficiently users complete setup.
If you're improving a checkout process, measuring drop-off rate and error rate helps identify whether changes reduce friction.
To make these metrics meaningful, you need a benchmark—something to measure against. Benchmarks could come from a previous version of the product, an earlier round of testing, or even from industry standards.
For example, if your baseline task success rate on mobile checkout is 58%, and a new design improves it to 78%, that 20% lift becomes a key input when quantifying ROI, especially if it correlates with higher conversions.
3: Align UX metrics with business KPIs to define goals
Once you’ve identified relevant UX metrics and established benchmarks, the next step is to connect those metrics to business outcomes.
UX metrics show how well a design performs, but to calculate ROI, you need to link those improvements to key performance indicators that the business already tracks.
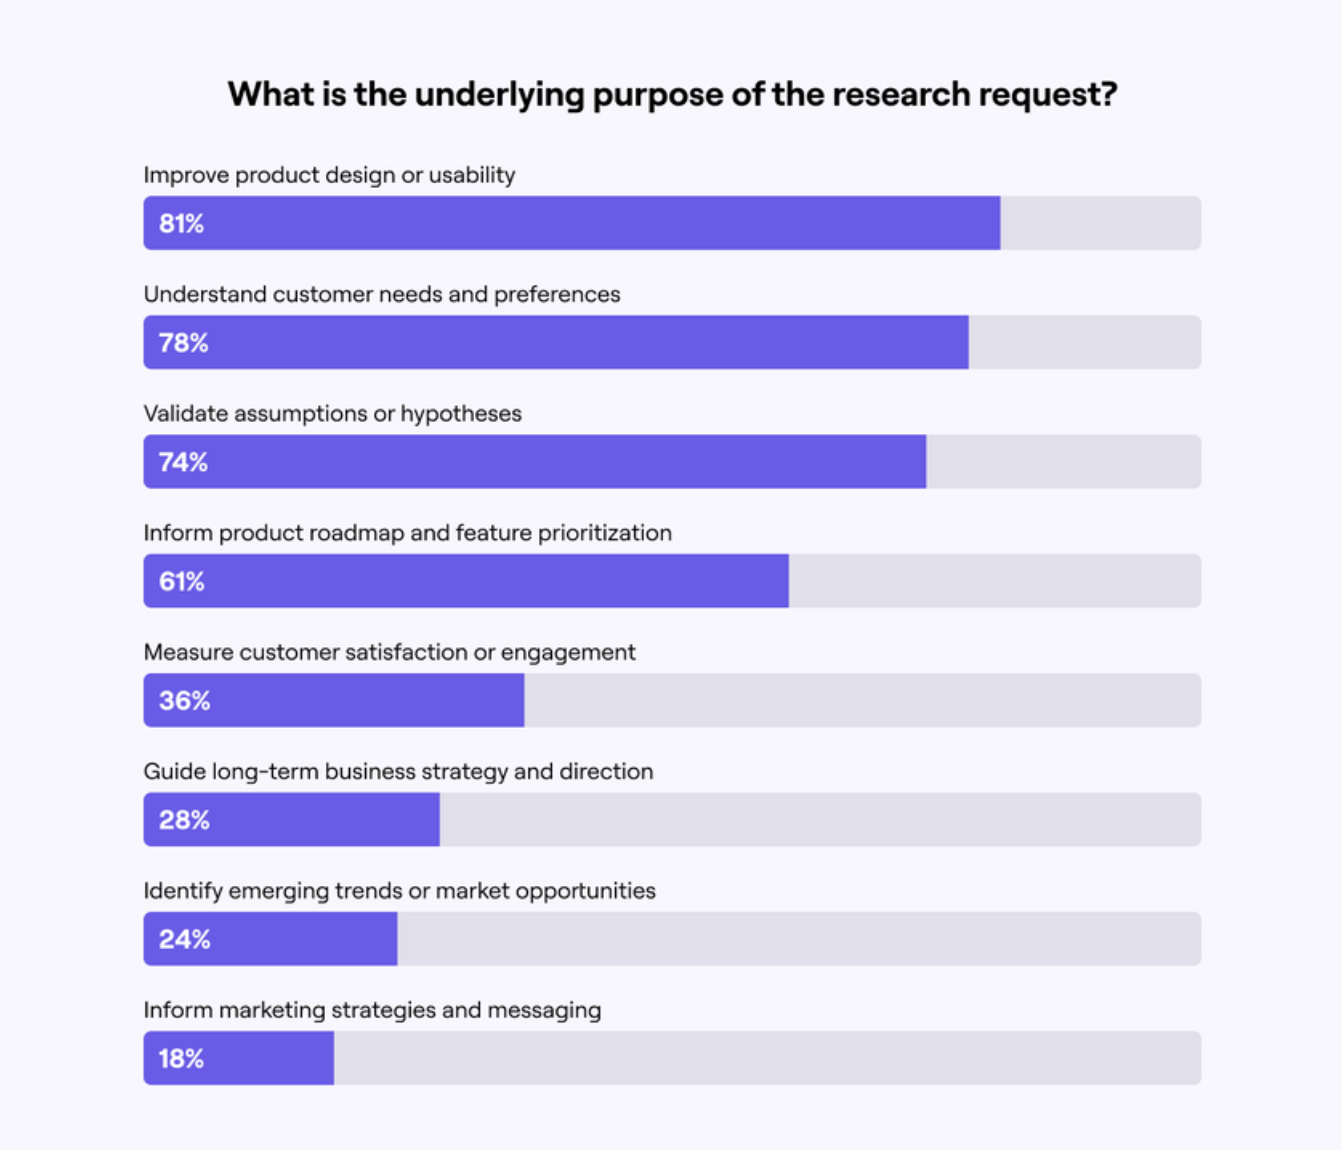
Our Future of User Research Report 2025 found the top three goals for research projects are:
- Improving usability (81%)
- Understanding customer needs (78%)
- Validating assumptions (74%)

But those goals only gain traction when tied to KPIs like:
- Conversion rate
- Feature adoption
- Revenue per user
- Customer retention
- Support ticket volume
Here’s how the alignment could look in practice:
UX metric | Related business KPI | Potential business impact |
|---|---|---|
Task success rate | Conversion rate | More users complete flows → higher conversion |
Time on task | Support ticket volume | Faster onboarding → fewer help requests |
Error rate in checkout | Revenue per user | Fewer drop-offs → higher order value |
NPS after redesign | Customer retention | Higher satisfaction → improved customer loyalty |
Mapping these UX metrics → business KPIs → potential business impact is a key part of translating return-on-experience to the ROI of UX research—and the value of UX as a whole. Instead of focusing on the investment, focus on the experience and its impact.
4. Collect data for calculating ROI
The next step is to gather actionable data that backs up your UX metrics = business impact story. You can pull data from a UX research repository, secondary research, or by using a purpose-built research platform like Maze.
Using Maze, you can gather data via:
- Usability tests to measure task success, time on task, and completion rates
- Feedback Surveys to gather user sentiment, net promoter score (NPS), or customer satisfaction feedback
- Card Sorting and Tree Testing to optimize information architecture
- Live Website Testing to see how users interact with your product in real-world conditions
- Interview Studies with AI-powered transcription and analysis and optional AI moderator
- Mobile Testing to gather in-context user insights on your users' chosen platforms
- Clips that record video, screen, and audio—so you can capture pain points and “aha” moments as they happen
5. Calculate the ROI of your research
Once you’ve got your user research data, you can calculate the ROI.
ROI is rarely a simple input-output equation—it requires a cost-benefit analysis that considers both direct and indirect business impact.
Geoffrey explains: “Say you make a design improvement, you need to frame exactly what impact it should have on the business side, like improving retention or reducing support phone calls, then calculate that new time earned into actual money.”
The standard cost-benefit formula still applies:
ROI = (Benefit – Cost) / Cost × 100
Here, ‘benefits’ might mean increased conversion rates, improved user satisfaction, higher retention, or operational savings like reduced support costs.
‘Cost’ could include researcher time, user testing tools, incentives, and other resources invested in the initiative.
For example:
- If UX improvements reduce monthly support calls by 5,000, and each call costs $6, that’s $30,000 in monthly savings
- A simplified onboarding flow that prevents 2,000 monthly tickets at $6 each creates $12,000 in monthly savings
Ultimately, a strong cost-benefit analysis of user research builds trust and an association with research → value.
*So how do you go about sharing these takeaways with stakeholders? *
5 Best practices for communicating ROI to stakeholders
Proving the ROI of research is important. But turning that proof into stakeholder buy-in depends on how you communicate it.
Stakeholders need credible, contextual evidence that shows research is driving meaningful business outcomes. Here’s how to present the results of your UX research in a way that decision-makers actually care about.
1. Tie ROI back to the UX research plan
Stakeholders don’t just want results—they want relevance. When presenting ROI, bring it back to the original UX research plan.
Remind your audience what the team set out to learn, why they were doing it (e.g. to diagnose a problem in the conversion funnel), what decisions were dependent on the research, and what would have happened without research. Then show how those risks were reduced or avoided.
For example:
→ We set out to understand why users dropped off mid-sign-up
→ To understand what was causing conversion to drop
→ And determine how to improve conversion rate
→ We identified that the FAQ pop-up was diverting users away from the sign-up flow
→ We moved this pop-up to show during onboarding once sign-up was complete
→ This change led to a 20% increase in task success rate on sign-up
2. Speak in business metrics, not UX terms
The fastest way to lose buy-in is by leading with usability scores and leaving the business impact vague.
Align outcomes with KPIs stakeholders care about: revenue, retention, NPS, support costs, etc. The conversion of return-on-experience to return-on-investment is crucial.
Geoffrey Crofte
UX Author and Senior UX Lead at Foyer Group
Share
Rather than focusing on what you found or what UX research method you used, focus on what results happened because of the change.
Translate your insights into metrics like:
- Conversion rates
- Retention and churn
- Customer acquisition cost
- Revenue or cost saved
- Customer support volume reduction
For example, don’t say, ‘users were confused by the navigation, with task drop-off coming in at 75%.’ Say, ‘simplifying navigation added 1,000 conversions/month, equating to $1,000 monthly profit.’
3. Show the chain reaction and visualize ROI across time
User experience research may not always directly change a number in a spreadsheet. But it’s the catalyst that sets off a domino effect to larger impact.
As Geoffrey explains: “Great experiences drive long-term business value—even if the financial impact isn’t instantly visible. For example, a more accessible form may not show immediate revenue, but it increases your market and reduces legal risk.”
This might look like: fewer usability issues = less rework = faster shipping + stronger customer experience = improved profitability.
Map these domino effects clearly in your UX research reports and presentations communicating user research to stakeholders. Use one user journey, one quote, or one fix to show the ripple effect.
Keep in mind that stakeholders may not see immediate business benefits from an improved user experience driven by user research. It often takes months before the positive impact becomes visible. Demonstrate how small improvements lead to broader business benefits which compound over time.
Geoffrey Crofte
UX Author and Senior UX Lead at Foyer Group
Share
4. Benchmark and validate your assumptions
If you’re estimating ROI, back it up.
It’s easy to throw UX statistics around or guestimate results, but it’s critical that your figures add up—especially when value from user research is already a more abstract return-on-investment to illustrate.
Use trusted sources like Nielson Norman Group, Gartner, or Forrester to show what similar investments typically return. This strengthens your credibility and shows that your team understands the broader industry landscape.


5. Bring stakeholders along early and often
Don't wait until the final moment to talk about ROI from UX research. Bring stakeholders into the UX research process early—during planning, during synthesis, and especially during alignment conversations.
Geoffrey recommends that you “use real user quotes, before/after scenarios, and customer journey maps to make the impact tangible. Reference industry standards or case studies to validate your assumptions.”
Starting the socialization of research insights, and surfacing the conversation around UX research impact early on is a key part of getting folks onboard. When people are part of the journey, they’re more likely to trust the outcome.
💡 Maze Automated Reports are an effective way to share UX research studies and findings. Show stakeholders what real people are saying about your product in a sleek, simple report.
What does the ROI of UX look like: Real-life examples
Seeing how other teams have translated insights into outcomes—faster launches, fewer mistakes, higher conversions—can help ground your own ROI story.
Here’s three examples of teams using Maze to drive measurable business impact through user research. Let them be your inspiration (or your proof!).
1. HqO: 3x research coverage, faster launches, and reduced development costs
HqO, a B2B workplace experience platform, was under pressure to launch new features quickly—but their traditional, only-moderated research process was too slow. Each study took weeks of planning, participant recruitment, and analysis. As a result, research was often skipped, and features shipped based on assumptions.
To fix this, the team switched to Maze—specifically to embrace mixed methods research and add a layer of rapid unmoderated testing into their research stack. They sped up prototype testing, testing early concepts with real users, validated assumptions in under 48 hours, and collected heatmaps and user feedback without needing a full research sprint.
Thanks to Maze, we’ve been able to triple the number of projects where we utilize user research. It helps us fuel insight-driven decisions at scale and deliver the solutions to our customers faster.
Anna Leach
Lead Product Designer at HqO
Share
By moving fast with Maze, HqO:
- Tripled the number of products tested with users
- Caught usability issues before development, not after
- Reduced time spent on costly redesigns and support fixes


2. Uxcel: Doubling activation rates through user-centric onboarding research
Uxcel, a platform for design education and career growth, noticed a growing gap between signups and active users. As the product expanded from learning into skill testing and job search, the existing onboarding flow no longer reflected user needs, leading to low activation and missed opportunities for conversion.
To fix this, Uxcel turned to Maze. By combining prototype testing and UX surveys, the team gathered insights on user motivation and identified critical usability issues in the signup journey.
The insights were clear: nearly half of new users weren’t coming to learn—they were coming to get hired or test their skills, but the onboarding didn’t reflect that.
Using Maze, Uxcel launched a redesigned flow that asked users to select their goal upfront. The results:
- Drop-off rates decreased
- Activation rates nearly doubled
- Users were more engaged and confident in the product experience
3. Soda Studio: 35% reduction in flow exit rates through A/B testing validation
Soda Studio, an Amsterdam-based UX & Product agency, noticed a steep drop-off in one client’s conversion funnel, costing them 35% of their potential sign-ups. Soda hypothesized that a tab bar in the app design was diverting users away from the intended flow mid-sign-up, negatively impacting completion rates.
But before making costly development changes, they needed data to prove their theory.
While traditional A/B testing would have required building and deploying multiple versions of the feature, the team used Maze to test their hypothesis at the design stage, before investing any resources into rewriting code.
Soda created two prototype variations—one with the tab bar and one without. They split tested participants and used heatmaps to track exactly where users clicked, and where they dropped off in the flow.

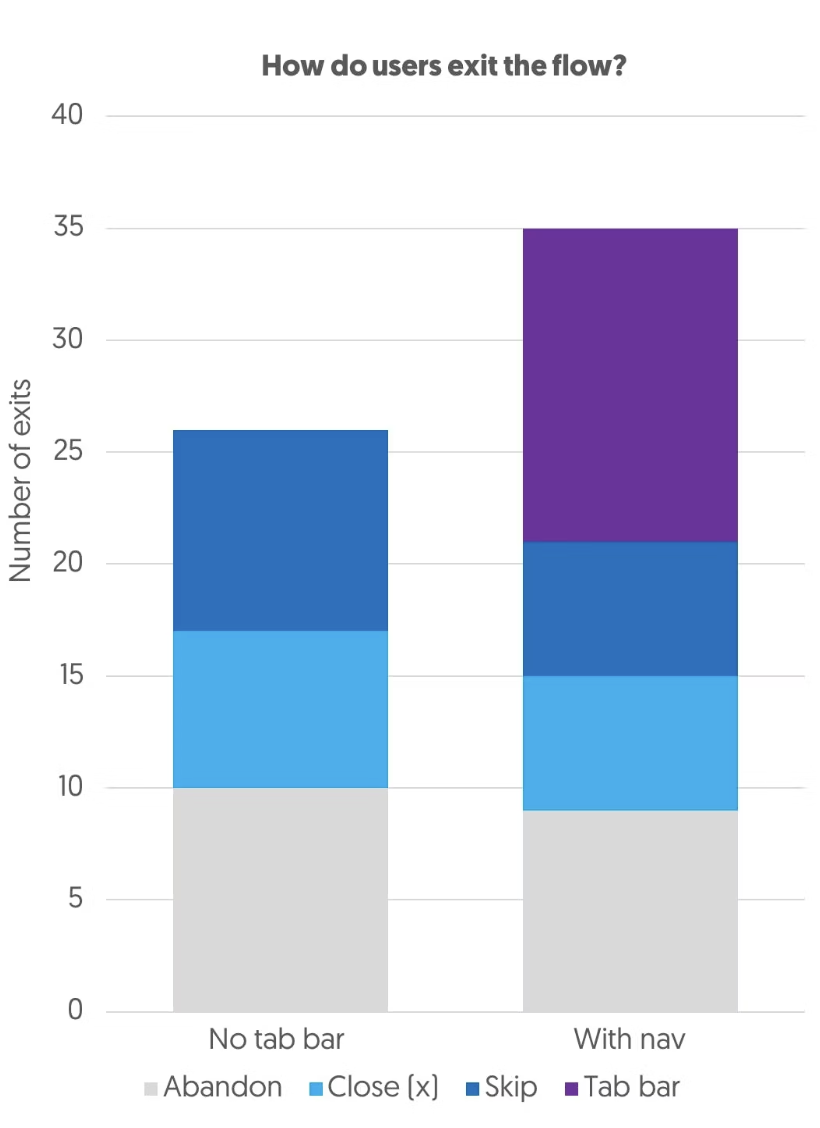
The results validated their hypothesis and provided clear direction for the final design:
- The version without the tab bar had a 32% success rate vs. 22% with the tab bar
- 40% of exits in the tab bar version came from users tapping the bar itself
- Overall flow exit rates were reduced by 35% when the tab bar was removed
By testing at the prototype stage, Soda saved their client from shipping a suboptimal design and avoided the costly cycle of building, launching, and then having to redesign based on poor performance metrics.
Start building your business case for user research
The ROI of user research is a mindset that helps you ask better questions, frame findings more strategically, and influence decisions at every stage of the product lifecycle.
If you want research to drive business value, you need to make your impact visible. Learn how to measure value, map it to KPIs, and make the ROI of user research undeniable.
That means making a business case for research, and thinking like a strategist, not just a researcher. If in doubt, bring it back to one prompt:
“If this research didn’t happen, what would the business have lost?”
That’s your ROI story. Start there, and build out.


Frequently asked questions about the ROI of user research
What is ROI in research?
What is ROI in research?
ROI in research measures the value generated from user research compared to its cost. It can include outcomes like higher conversions, reduced development time, or fewer support tickets—all tied back to business impact and KPIs.
What is the business value of user research?
What is the business value of user research?
The business value of user research refers to how research contributes to measurable business outcomes, such as increased revenue, lower costs, or improved customer retention.
For example, say usability testing reveals that users are abandoning a form. After redesigning it based on those insights, form completion improves by 20%, leading to 1,000 more monthly signups. If each signup is worth $10, that’s an added $10,000 per month—or $120,000 per year—driven by research.


")